
Introduction
RPN, or Risk Priority Number, is the score FMEA teams calculate by multiplying Severity, Occurrence, and Detection ratings to rank how urgently a potential failure mode needs attention.
If you're a quality engineer, auditor, or compliance lead running DFMEA or PFMEA under AS9100D, ISO 9001, IATF 16949, or ISO 13485, this number shows up constantly in your worksheets. Get it wrong, and you don't just skew engineering priorities—you weaken the credibility of your corrective actions in front of an auditor.
RPN is also one of the most cited and most misunderstood figures in quality management. Teams miscalculate it, misweight it, or treat it as the only reason to act (or not act) on a risk.
This article breaks down what RPN actually measures, how to calculate it step by step, what makes a score actionable, and where the method breaks down in practice.
Key Takeaways
- RPN = Severity × Occurrence × Detection, scored 1–10 each, for a range of 1–1,000
- No universal "acceptable" RPN exists — thresholds depend on your industry and risk tolerance
- AIAG-VDA and SAE J1739 now favor Action Priority tables because RPN can mask severity-critical risks
- A high-Severity failure cause deserves action regardless of its overall RPN
- Treat RPN as one input among several, not the final word on what gets fixed
What Is RPN in FMEA?
RPN is the product of three independent ratings assigned to each failure cause during a Failure Mode and Effects Analysis: Severity, Occurrence, and Detection. Multiply them together and you get a single number that's designed to do one job: rank failure modes so your team knows where to spend limited engineering and audit-response time first.
The formula is straightforward:
RPN = S × O × D
With each factor scored on a standard 1–10 scale, the resulting RPN falls between 1 and 1,000. A failure cause scoring low across all three factors might land at RPN 8. One scoring high across all three could hit 1,000.
RPN vs. Related Metrics
RPN isn't the only risk-ranking tool in FMEA documentation, and mixing it up with related metrics causes confusion during audits:
- Criticality (S×O): Drops Detection entirely, focusing only on how bad the failure is and how often it happens
- Action Priority (AP) tables: The AIAG-VDA and SAE J1739 approach, ranking risk as High, Medium, or Low based on specific S-O-D combinations rather than a multiplied score
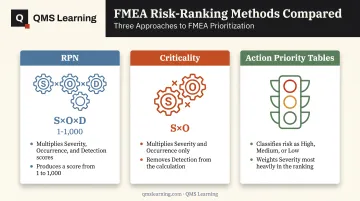
RPN itself traces back to Failure Modes, Effects and Criticality Analysis (FMECA), where it gave FMEA a quantifiable priority layer beyond a simple pass/fail list. In practice, most teams calculate RPN twice per failure cause: once as an initial score, and again as a revised score after corrective actions are implemented, to demonstrate measurable risk reduction.
How Is RPN Calculated? (Step-by-Step)
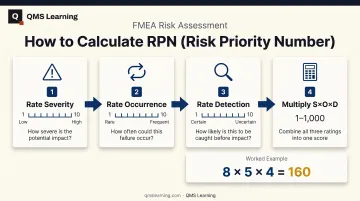
For each failure cause identified in the FMEA, the team assigns three independent 1–10 ratings, then multiplies them. That's the entire mechanical process. The judgment behind each number is where things get harder.
Step 1: Rate Severity (S)
Severity scores the worst-case impact of the failure's effect on the customer, product, or user. A 1 means no noticeable effect. A 10 means a safety hazard or regulatory violation.
This rating should never be softened just to bring down the final RPN. If a failure could genuinely hurt someone or trigger a compliance violation, the Severity score needs to reflect that honestly, no matter what it does to the math downstream.
Step 2: Rate Occurrence (O)
Occurrence estimates how likely the failure cause is to actually happen, again on a 1–10 scale, where 1 is remote and 10 is near-certain. Anchor this rating to historical failure-rate data whenever it exists. Guessing introduces the same subjectivity problems that undermine RPN's credibility in the first place.
Step 3: Rate Detection (D)
Detection rates how likely your current process or design controls are to catch the failure before it reaches the customer. A 1 means your controls will almost certainly catch it. A 10 means no current control can detect it at all — the failure would slip straight through.
Step 4: Multiply the Three Ratings
Once all three ratings are assigned, multiply them:
RPN = Severity × Occurrence × Detection
Here's a worked example: a failure cause rated Severity = 8, Occurrence = 5, Detection = 4 produces an RPN of 160 (8 × 5 × 4 = 160).
Every failure cause in the FMEA worksheet gets this same treatment. Sort the full list by descending RPN to build your action priority list.
HBM's FMEA resource guide shows a practical result: an initial S/O/D of 7/8/5 (RPN 280) reduced to 7/6/4 (RPN 168) after corrective action, a 40% drop.
Interpreting RPN Scores: Is There a "Good" RPN?
There's no universal magic number that separates an acceptable RPN from an unacceptable one. Thresholds vary by industry, product complexity, and how much risk your organization is willing to carry.
In one illustrative case study, ASQ documented a tablet-packaging FMEA where four failure modes started above RPN 125, and corrective actions brought every one below that mark. That's a case-specific endpoint, though, not an industry-wide automotive or medical device rule.
Most organizations settle on one of two evaluation methods:
- Fixed threshold: Any RPN above a set number (say, 100 or 125) automatically triggers a mandatory action
- Top N approach: Address the highest 10 or 20 RPNs on the list regardless of where the threshold falls
The Equal-Weighting Flaw
Here's where RPN math breaks down. Two failure causes can land on the exact same RPN, say 135, while carrying very different real-world consequences. Compare two causes that both score 135:
| Severity | Occurrence | Detection | RPN |
|---|---|---|---|
| 9 | 5 | 3 | 135 |
| 3 | 5 | 9 | 135 |
Same score, radically different risk.
A starker example: S/O/D of 10/4/2 produces an RPN of 80. S/O/D of 7/4/4 produces 112, a higher RPN despite lower Severity.
A failure mode with Severity 10 should still get flagged for review even when its RPN looks modest. That score signals a safety or regulatory consequence that multiplication can mask.
Why Action Priority Tables Took Over
This masking problem is exactly why the AIAG-VDA FMEA Handbook and SAE J1739:2021 shifted toward Action Priority (AP) tables. Instead of multiplying three numbers into one score, AP ranks risk as High, Medium, or Low based on specific S-O-D combinations, weighting Severity more heavily by design.
AP does not retire RPN for tracking progress. To measure improvement after corrective action, use the percent RPN reduction formula:
% reduction = (RPNi – RPNr) / RPNi
Using the earlier example: (280 – 168) / 280 = 40% reduction. This gives auditors and engineering teams a clean way to quantify progress, even if you're still using traditional RPN alongside AP scoring.
Best Practices and Common Mistakes When Using RPN
Most RPN problems trace back to a handful of recurring habits. Watch for these:
- Treating S/O/D as objective when they're not. These are judgment calls. Different engineers will rate the same failure cause differently unless you use calibrated scale definitions and cross-functional review.
- Gaming the score. Shaving a point off Occurrence or Detection to bring a high-Severity failure's RPN below the action threshold doesn't fix anything. It just hides a real risk behind cleaner paperwork.
- Inconsistent scales across projects. If one FMEA rates Occurrence differently than the next, your RPNs stop being comparable and stop being defensible when an auditor asks how you got there.
The fix for most of this is consistency: one documented rating scale, used the same way across every FMEA in your organization, reviewed by more than one person.
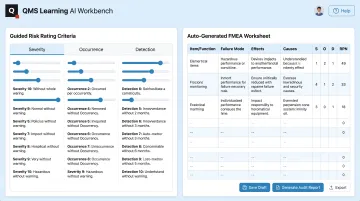
AI-guided support helps lock that consistency in. QMS Learning's AI Workbench walks engineers, including junior staff with no prior FMEA background, through consistent Severity, Occurrence, and Detection criteria, then generates an audit-ready FMEA worksheet in minutes rather than days.
QMS Learning's Commercial Aviation pathway builds FMEA scoring into coursework alongside AS13000-aligned 8D and CAPA methods, so rating logic stays consistent from training through to the worksheet an auditor reviews.
Conclusion
RPN takes three subjective judgment calls — Severity, Occurrence, and Detection — and turns them into one number your team can sort and act on. That's genuinely useful. It's also easy to misuse.
Calculating and interpreting RPN correctly matters more than chasing an arbitrary "good" score. A moderate RPN should never override a high Severity rating. Severity signals consequences that multiplication can hide.
Use RPN as one input among several — paired with engineering judgment, Action Priority tables, and tools that keep FMEA scoring consistent — not as the sole basis for what gets fixed first.
Frequently Asked Questions
How do you calculate an RPN score?
Multiply Severity, Occurrence, and Detection ratings, each typically scored 1–10, for a specific failure cause. The result is a score between 1 and 1,000.
What is a good RPN score?
There's no universal "good" RPN. Acceptable ranges depend on your industry, risk tolerance, and regulatory requirements. A high-Severity failure should be addressed regardless of the overall number.
What does RPN stand for in FMEA?
RPN stands for Risk Priority Number. It's the metric used in Failure Mode and Effects Analysis to rank and prioritize potential failure causes.
Why do AIAG-VDA and SAE J1739 now recommend Action Priority tables instead of RPN?
Because RPN's equal weighting of Severity, Occurrence, and Detection can mask severity-critical risks. A failure with high Severity but moderate Occurrence and Detection can score lower than it should.
Can two failure modes have the same RPN but different actual risk levels?
Yes. Two failure causes can multiply to an identical RPN, like 135, while having very different Severity scores behind that number, and therefore very different real-world consequences.
Should a failure mode with high severity always be addressed even if its RPN is low?
Yes. Most FMEA best practices call for addressing high-Severity failure causes regardless of RPN, since Severity reflects safety or regulatory consequences that a multiplied score can understate.