
Introduction
Ask a room full of quality engineers to draw a fishbone diagram, and every hand goes up. Ask them to prove the cause they circled is actually the root cause, and the room gets quiet.
That gap is where most corrective actions fail. According to research on root cause analysis published in Quality Magazine, problems addressed before a team asks enough "why" questions will generally recur, even after a fix gets documented and closed.
Quality managers, engineers, and compliance teams working under AS9100, ISO 9001, ISO 13485, or EHS frameworks see the fishbone diagram (also called an Ishikawa or cause-and-effect diagram) in nearly every CAPA file.
It's a visual brainstorming tool that sorts potential causes into categories shaped like a fish skeleton. Used correctly, it holds up under audit. Used as a box-checking exercise, it doesn't.
Below: what the tool actually is, how to build one step-by-step, how to pair it with the 5 Whys, and when to reach for something else.
Key Takeaways
- A fishbone diagram sorts potential causes of one specific problem into categories (commonly the 6Ms) branching off a central spine
- Quality and compliance teams use it to move past symptoms and document structured problem-solving for auditors
- Pair it with the 5 Whys: fishbone widens the search for causes, 5 Whys narrows it to a testable root cause
- Team consensus or dot-voting is not proof; validate the leading cause with data before writing a corrective action
What Is a Fishbone Diagram (Ishikawa Diagram)?
A fishbone diagram (also called an Ishikawa diagram) maps potential causes of a problem into categories that branch off a central spine. Kaoru Ishikawa developed it in the 1960s, and it remains one of the Seven Basic Tools of Quality. Teams use it to build a comprehensive, categorized list of causes for one clearly defined problem—before anyone tests a single change.
The structure breaks down into four parts:
- Head – the problem statement, boxed at the right end of the spine
- Spine – the horizontal line connecting causes to the effect
- Bones – the major cause categories branching off the spine
- Sub-branches – contributing factors and root-level causes nested under each bone
The 6Ms: The Manufacturing Default
Manufacturing teams typically use six category prompts:
| Category | What it covers |
|---|---|
| Manpower | Training, staffing, skill gaps, fatigue |
| Machine | Equipment condition, calibration, maintenance |
| Material | Raw material variation, supplier quality |
| Method | Work instructions, procedures, process design |
| Measurement | Gauge accuracy, inspection method, data collection |
| Mother Nature | Environment: temperature, humidity, contamination |
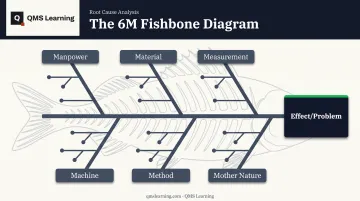
These categories are prompts, not mandatory headings. Service and healthcare teams often swap in categories like People, Provisions, Procedures, Place, and Patrons instead, since "Machine" and "Material" don't map cleanly onto a clinic or a call center.
Fishbone vs. 5 Whys, in one line: the fishbone diagram is divergent, meaning it widens the search across categories to surface a broad list of possible causes. The 5 Whys is convergent: it drills down one branch at a time until a single root cause surfaces.
Why Fishbone Diagrams Are Used in Quality and Compliance Root Cause Analysis
AS9100, ISO 9001, and ISO 13485 all require documented, systematic investigation before a nonconformance or CAPA closes. None of them names the fishbone diagram specifically.
What auditors reviewing a corrective action file want to see is evidence that the team looked broadly before settling on a cause, not just the first idea raised in the meeting.
Without a structured tool, the pattern is predictable:
- A team jumps to the first plausible cause
- The corrective action addresses that symptom
- The nonconformance resurfaces weeks or months later
- The file shows a closed CAPA that didn't actually close anything
ASQ describes the fishbone diagram as one accepted root cause tool among several, useful for structuring brainstorming rather than proving a cause is correct. That distinction matters for audit defensibility.
A fishbone diagram in the file shows a team did structured problem-solving. It doesn't, on its own, show they found the right answer. When an auditor asks "how did you validate this?", that's a fair question, and one plenty of nonconformance files can't answer.
How to Build a Fishbone Diagram (Step-by-Step)
The flow runs one direction: from a specific problem statement to a prioritized, testable root-cause hypothesis. Skip a step, and the diagram turns into a wall of sticky notes nobody can act on.
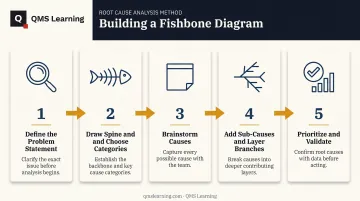
Step 1: Define the Problem Statement
Vague problem statements produce vague diagrams. "Quality problems" gives a team nothing to brainstorm against. The head of the fish needs a statement covering:
- Location – which line, station, or process
- Timing – when it started or was discovered
- Frequency – how often it happens
- Impact – scrap, rework, complaint, or safety risk
"Torque values on Station 4 fastener installs have failed final inspection on 6 of the last 40 units since October" gives a team something to investigate. "Fastener quality issues" does not.
Step 2: Draw the Spine and Choose Categories
Draw the horizontal spine with the problem statement boxed at the right end. Then pick a category framework. The 6Ms work as a manufacturing default:
- Man – people, skills, staffing
- Machine – equipment, tools, fixtures
- Material – parts, consumables, incoming quality
- Method – procedures, work instructions, sequence
- Measurement – gauges, inspection, data collection
- Mother Nature (Environment) – temperature, humidity, cleanliness
Customize categories to fit the actual process. A software-heavy operation might swap "Machine" for "System," for example.
Step 3: Brainstorm Causes Within Each Category
This is where facilitation quality decides whether the diagram is useful or theater. A few rules that work:
- One cause per sticky note, not three ideas bundled into one entry
- Round-robin contribution so the loudest voice in the room doesn't dominate
- Ask "why does this happen?" repeatedly within each category, not just once
Junior engineers often notice causes senior staff have stopped seeing. Round-robin format is what actually gets those ideas onto the board.
Step 4: Add Sub-Causes and Layer the Branches
Keep branching off each cause until it's specific enough to test or measure. "Poor training" isn't testable. "No documented calibration procedure for Station 4 torque wrenches" is. This is also the natural point where the 5 Whys gets nested into a single branch, which is covered next.
Step 5: Prioritize and Validate Before Acting
Multi-voting or dot-voting narrows a crowded diagram to the two or three causes worth pursuing. But a vote is an opinion, not evidence.
Before a corrective action gets written, check the leading cause against real data: inspection records, maintenance logs, training files, or other process data on hand. Skip this step, and the diagram becomes the fix instead of the starting point for one.
Using the 5 Whys with a Fishbone Diagram to Confirm the Root Cause
A fishbone diagram widens the search. The 5 Whys narrows it. Used together, a team fills the diagram with every plausible cause across categories, then takes the highest-priority cause and drills through one branch until they hit something they can actually fix.
The mechanics: for each significant cause, ask "why does this happen?" and keep asking, typically around five times, until the answer describes something systemic rather than a person.
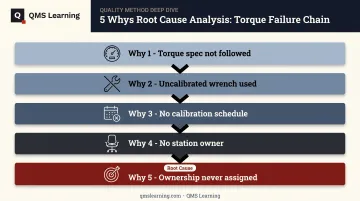
A Method branch, worked through:
- Why did the part fail inspection? The torque spec wasn't followed.
- Why wasn't it followed? The operator used an uncalibrated wrench.
- Why was it uncalibrated? There's no calibration schedule for that tool.
- Why is there no schedule? Nobody owns the calibration program for that station.
- Why does nobody own it? Procedure ownership was never assigned when the line was set up.
The fix is assigning procedure ownership and building a calibration schedule. Retraining the operator is a one-time correction; ownership and a schedule stop the defect from coming back.
The most common failure mode is stopping at the first "why" that feels satisfying. OSHA's incident investigation guidance warns that concluding an incident happened because of carelessness or a missed procedure step, without going further, misses the equipment, training, and supervision gaps that actually need fixing.
The same pattern shows up in nonconformance investigations: "operator error" gets written down, the file closes, and the defect returns three months later under a different part number.
Knowing which method to reach for is its own skill. Fishbone, 5 Whys, FMEA, and CAPA solve different problems, and picking the wrong one wastes time without fixing anything.
QMS Learning's AI Workbench includes a Method Router built around that decision. A team describes the problem in plain language, and the Router diagnoses whether it's an isolated incident, a systemic pattern, or a supplier issue before recommending a method.
For a defect traced to one supplier across three separate jobs, the Router selected a 5-Why analysis paired with a Supplier CAPA rather than FMEA, since FMEA is built for anticipating failures in new processes, not closing ones that already happened. The Workbench then challenges the team's proposed root cause instead of accepting the first answer, and drafts the audit-ready documentation once the investigation wraps up.
Where Fishbone Diagrams Work Well and Where They Fall Short
Fishbone diagrams earn their place in specific situations, usually triggered by an audit finding, a customer complaint, or a CAPA that's already been reopened once:
- Nonconformance investigations
- Safety incident reviews
- Recurring defect analysis
- Supplier quality issues
- Process capability studies
Three misconceptions show up constantly:
- Treating a voted cause as a proven root cause instead of a hypothesis to test
- Treating the completed diagram as the fix itself, rather than the starting point for data collection
- Confusing a symptom ("operator missed a step") for a genuine category cause ("no procedure ownership")
Those misuse patterns point to a larger limit: the fishbone is not always the right tool.
When to skip it:
- Complex, multi-causal incidents — such as a safety event where three systems fail at once — need a fuller investigative framework than one diagram can hold
- Proof of causation over team consensus — customer audits and regulatory recalls need more rigor than a voted diagram
- Missing subject-matter expertise in the room — the diagram will look complete and still be wrong
For those higher-stakes cases, fault tree analysis, FMEA, or a formal 8D process typically does a better job. QMS Learning's Root Cause & CAPA course covers fishbone, 5-Why, and fault tree analysis side by side, specifically so teams learn which fits which situation instead of defaulting to whichever tool they learned first.
Conclusion
A fishbone diagram is a brainstorming and organizing tool. It is not proof of causation, and a team vote doesn't change that. It performs best paired with real data and the 5 Whys, which turn a broad list of possibilities into one testable answer.
In regulated environments, a correctly built fishbone diagram gives an audit file real substance: evidence that a team looked wide before narrowing down. A poorly facilitated one produces paper compliance, a diagram in the folder, a closed CAPA, and a defect that comes back.
Will Trikha built QMS Learning after 20 years writing and closing audit findings, including more than 1,000 written as an auditor alone. The pattern he kept seeing wasn't a lack of tool knowledge. It was teams who could draw a fishbone diagram in training and still froze when a real nonconformance landed on their desk.
Building that diagnostic judgment across a whole team, not just teaching the tool, is what actually stops repeat nonconformities. QMS Learning's practitioner-built courses and AI-guided Workbench make that capability permanent, rather than something that walks out the door with one senior expert.
Frequently Asked Questions
How are the 5 Whys used with a fishbone diagram?
The fishbone diagram generates a broad list of possible causes sorted by category. The 5 Whys is then applied to the most likely cause to drill down into a specific, actionable root cause.
What are the 7 steps of root cause analysis?
General RCA sequences include defining the problem, collecting data, identifying possible causes, confirming the root cause, developing corrective actions, implementing them, and verifying effectiveness. The fishbone diagram supports the cause-identification steps in that sequence.
What are the 5 P's of the fishbone diagram?
Some service and healthcare frameworks use "P" categories—People, Provisions, Procedures, Place, and Patrons—instead of the manufacturing-focused 6Ms. Choose categories that fit the process, not a fixed list.
What are the 6 Ms in a fishbone diagram?
The standard manufacturing category set is Manpower, Machine, Material, Method, Measurement, and Mother Nature (often labeled Environment).
Is a fishbone diagram the same as an Ishikawa diagram?
Yes. Both names refer to the same tool, created by Kaoru Ishikawa and also called a cause-and-effect diagram.
When should you not use a fishbone diagram?
Avoid it for complex, high-stakes, or multi-causal incidents that need proof of causation rather than team consensus. Use a more rigorous method such as fault tree analysis or FMEA instead.