Introduction
Many quality managers walk into a process audit with a stack of procedures and no clear way to connect them. Auditors trained on turtle diagrams in a classroom often forget how to apply the tool once they're standing on the shop floor.
A turtle diagram is a one-page visual tool that maps a single process's inputs, outputs, resources, and controls around a central "process" box. It gives auditors a single view of how the process really runs—and where procedures alone leave gaps.
If you manage quality, lead internal audits, or own compliance under ISO 9001, AS9100D, ISO 13485, or IATF 16949, you'll get what a turtle diagram is, why auditors rely on it, how to apply it step-by-step on a live audit, and when it isn't the right tool.
Key Takeaways
- A turtle diagram maps a process plus six elements (inputs, outputs, who, what, how, measures) on one page for faster audit tracing.
- Auditors favor it because it links resources, controls, and evidence in one view instead of scattered documents.
- Applying it well takes three steps: define the process, map the resources, then verify outputs and measures.
- The biggest misuse is treating the completed diagram itself as proof of compliance.
- No ISO standard requires it; it's an operational preference, not a certification requirement.
What Is a Turtle Diagram?
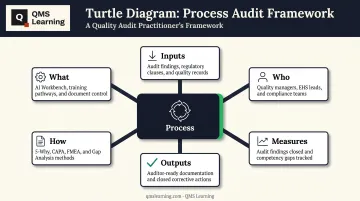
A turtle diagram is a schematic that arranges a process's six key characteristics around a central process box: Inputs, Outputs, What, Who, How, and Measures. The layout resembles a turtle's body, head, legs, and tail, which is where the name comes from.
The goal is simple. It gives auditors and process owners a single-page way to confirm a process has adequate resources, controls, and metrics before judging whether the process is actually effective.
The Six Elements
| Element | What it captures |
|---|---|
| Inputs (head) | Customer needs, requirements, materials, information that trigger the process |
| Outputs (tail) | Intended results and evidence the requirements were met |
| What | Equipment, materials, facilities, software, and other non-human resources |
| Who | Process owner, operators, and required competence |
| How | Procedures, work instructions, and operational controls |
| Measures | Metrics and data used to judge performance |
For a fuller walkthrough of the layout, see Quality Magazine's overview of the turtle diagram.
Turtle Diagram vs. SIPOC vs. Flowchart
People confuse these three constantly. Here's the actual difference:
- SIPOC maps the broader supplier-input-process-output-customer flow across a process chain. It's a wide-angle lens.
- Turtle diagram drills into one specific process box, detailing the resourcing and control context around it.
- Flowchart documents sequential steps in order. It does not capture surrounding resources, competence, or controls.
Is It an ISO Requirement?
No. No ISO standard names or mandates a turtle diagram. Organizations and auditors adopt it voluntarily because it helps satisfy process-approach and evidence-related clauses in ISO 9001, not because any clause specifies the format.
Why the Turtle Diagram Is Used in Process Audits
Process audits require auditors to trace inputs through to outputs, checking that a process actually delivers what it's supposed to. That's the process approach at the heart of ISO 19011 auditing guidance, and it's harder to do than it sounds when the evidence lives in six different systems.
Which ISO 9001 Clauses Get Mapped
Turtle diagrams commonly support audit trails across these clause areas:
- Context and interested parties (4.1, 4.4) — inputs and constraints
- Risk-based thinking (6.1) — risk sources and performance influences
- Resources and competence (7.1, 7.2) — the "what" and "who" legs
- Control of external providers (8.4) — suppliers, outsourced processes
- Nonconformity and corrective action (10.2) — output and performance gaps
What Goes Wrong Without One
Without a structured way to trace a process end-to-end, auditors tend to narrow their focus to documents and records alone. That narrow lens misses competence gaps, calibration lapses, and cross-functional handoff failures between departments.
This isn't a minor risk. DNV's audit data from 2023 to 2025 found that more than half of audited organizations carried Chapter 6 nonconformities, with Clause 6.1 (risk-based thinking) ranking as the second-most-common ISO 9001 finding overall. Many of those risk-related gaps trace back to resourcing and interface issues a turtle diagram is designed to surface.
From Manual Mapping to Automated Output
Building a turtle diagram from scratch, for every process, every audit cycle, is slow work. AI-guided diagnostic tools are starting to change that math.
QMS Learning's AI Workbench and Method Router handle adjacent diagnostic work. A team describes the compliance problem in plain language; the system classifies it and generates the matching audit-ready artifact—CAPA, FMEA, or gap analysis—instead of a blank template every time.
That same logic applied to process mapping is the shift quality teams need: less time reconstructing structure, more time verifying evidence.
A completed turtle diagram also functions as an informal contract between the process owner and leadership. When output expectations rise, the diagram makes it obvious that resource needs must rise with them, before that gap becomes a finding.
How to Use a Turtle Diagram in a Process Audit
The mechanics are straightforward. The process owner (or the auditor, working with them) fills in the six surrounding boxes before or during the audit. The core box captures the value-adding steps and their sequence, while the six legs provide the context an auditor needs to judge whether the process is actually under control.
The "how" leg ties directly to SOPs and work instructions, giving auditors a clear reference point for spotting deviations. The "measures" leg closes the loop, showing whether the process is hitting its objectives or needs corrective action.
Here's how that plays out in practice, step by step.
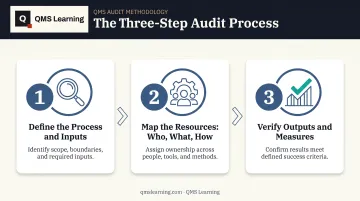
Step 1: Define the Process and Its Inputs (Head)
Start by naming the process as a verb (for example, "inspect incoming material"), then define its scope and boundaries. Identify the inputs: materials, information, and supplier requirements.
During the audit, verify supporting records tied to those inputs:
- Inspection results
- Approved Supplier List status
- Purchase order requirements
Step 2: Map the Resources — Who, What, and How (Legs)
This is where most audits find real gaps. Check three things against actual evidence:
- Personnel and competence — cross-check against training records and the training matrix
- Equipment and materials — verify against calibration logs and maintenance records
- Procedures — confirm the process is actually run the way the SOP describes
Flag any deviation the moment you spot it. Don't wait until the end of the audit to note it.
Step 3: Verify Outputs and Performance Measures (Tail)
Confirm the output meets its defined acceptance criteria. Then check whether performance indicators actually align with stated objectives.
Don't audit every box with equal depth. Drill deeper into records only where a metric signals an actual gap. If a process is hitting its targets consistently, spend your time elsewhere.
Key Factors That Affect Turtle Diagram Effectiveness in Audits
A turtle diagram is only as good as the inputs behind it. Five factors determine whether it actually helps an audit or just looks tidy on paper:
- Build accuracy: outdated assumptions mislead everyone who uses the diagram
- Cross-functional input: legs filled only by quality miss operational reality
- Metric alignment: tie measures to customer and business objectives, not activity counts
- Update frequency: refresh when people, equipment, or procedures change
- Auditor interpretation: read the six legs together, not as isolated checkboxes
Common Mistakes, Misconceptions, and When the Turtle Diagram Isn't the Right Fit
The tool gets misused often enough that the patterns deserve direct names.
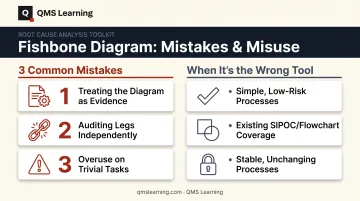
Mistake 1: Treating the diagram as evidence itself. A completed turtle diagram is a map, not proof. It still requires underlying records—training logs, calibration certificates, and batch records—to support any conclusion drawn from it.
Mistake 2: Auditing each leg independently. The real findings live in the interactions. A competence gap in "who" that shows up as a poor result in "measures" is easy to miss if you check each box separately instead of tracing the connection.
Mistake 3: Overuse. Building a full turtle diagram for every minor task creates documentation for its own sake. Quality Digest's long-running caution on this point is direct: elaborate tools applied to trivial issues create waste, not insight.
When it's the wrong tool:
- Very simple, low-risk processes with minimal variation
- Organizations that already have clear SIPOC maps and flowcharts covering the same ground
- Stable processes where inputs, owners, and measures rarely change
The tell-tale sign a team is misusing the tool: reaching for the turtle diagram template because it exists, not because the process genuinely needs six-dimensional context.
Conclusion
A turtle diagram gives auditors and process owners a single-page way to see inputs, resources, controls, and outputs together, instead of chasing them across five separate documents. It's a mapping and communication tool, not a compliance requirement, and its value depends entirely on applying it to genuinely complex or cross-functional processes rather than everything by default.
QMS Learning's AI Workbench extends that same clarity beyond process maps: it diagnoses the compliance problem, routes the right method, and produces audit-ready documentation so junior engineers can act without waiting on a senior auditor. Qualified teams can start with a free 2-seat pilot and build that capability in-house.
Frequently Asked Questions
How is the turtle diagram used in auditing?
Auditors use it to trace a process's inputs, resources, controls, and outputs on one page. This helps them decide where to focus evidence-gathering and follow the audit trail into related processes.
What are the six elements of a turtle diagram?
Inputs, outputs, what (equipment and materials), who (personnel and competence), how (procedures and methods), and measures (performance indicators), all surrounding the central process box.
Is a turtle diagram required by ISO 9001?
No. No ISO 9001 clause mandates a turtle diagram specifically. It's a voluntary tool many organizations use to satisfy process-approach and evidence requirements.
What's the difference between a turtle diagram and a SIPOC diagram?
SIPOC maps a broader supplier-to-customer flow across a process. A turtle diagram focuses on the internal resourcing and control detail of one specific process.
Who should create the turtle diagram for a process audit?
It's best built collaboratively by the process owner and relevant stakeholders, not the auditor alone. They hold the accurate, current knowledge of resources, competence, and controls.
How often should a turtle diagram be updated?
Revisit it whenever inputs, resources, personnel, or performance objectives change. An outdated diagram stops being a reliable audit reference the moment reality moves past it.