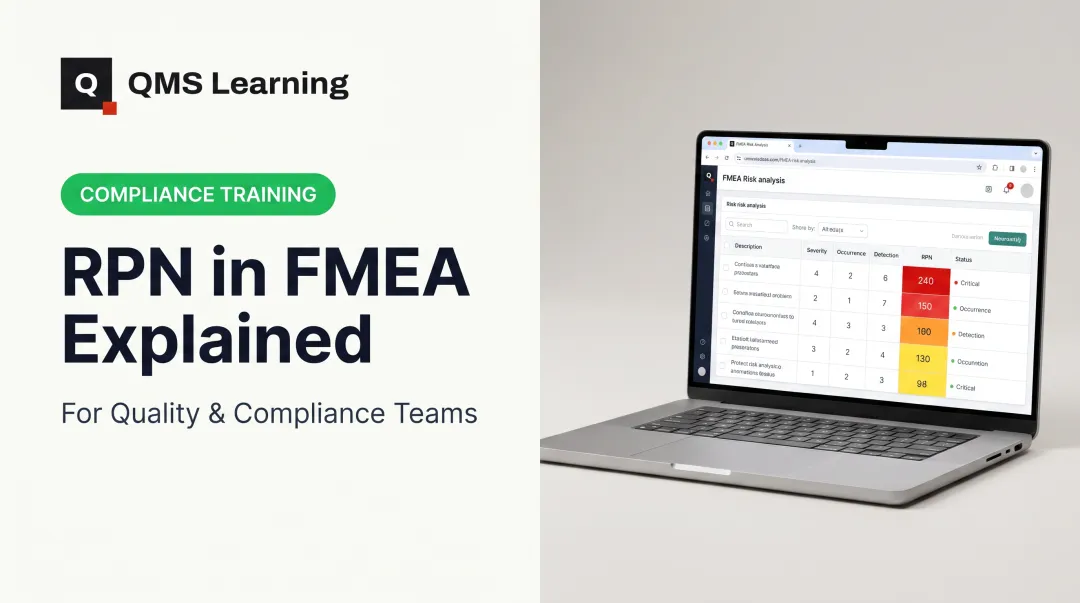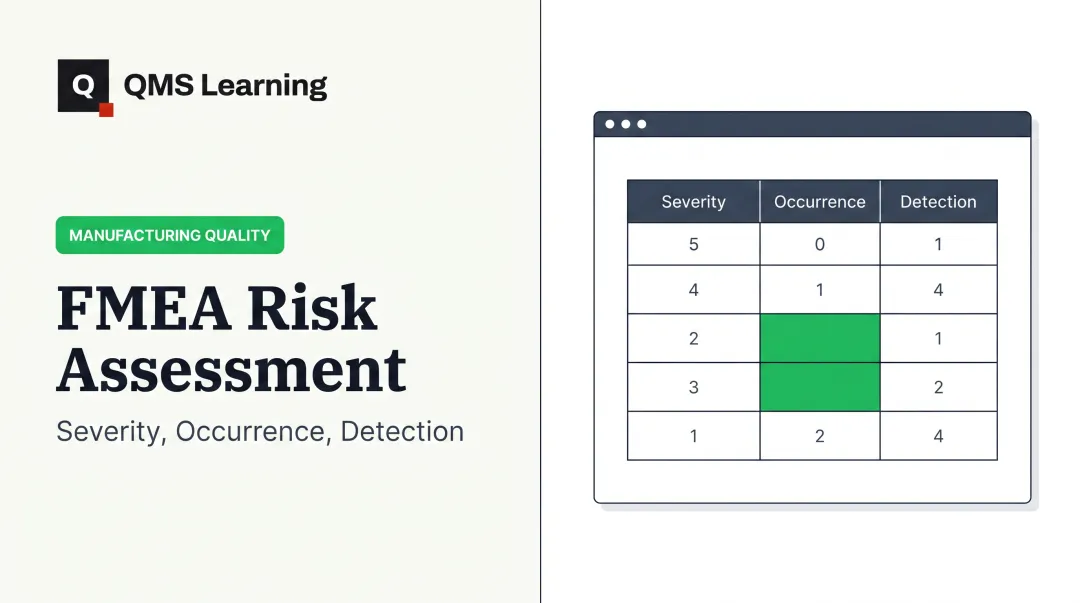
That's where Severity, Occurrence, and Detection come in. Together, they turn a qualitative conversation about what could go wrong into a ranked list of what to fix first.
Many quality teams struggle with this step. They know the three letters, but they rate them inconsistently, mix up what each one actually measures, or lean on RPN as if it were gospel. That inconsistency is one of the fastest ways to get an FMEA flagged during an AS9100D or IATF 16949 audit.
This article breaks down what S, O, and D actually represent, how the 1-10 scales work, how RPN and Action Priority get calculated, and where teams most commonly get it wrong.
Key Takeaways
- Severity, Occurrence, and Detection use independent 1-10 scales to rate impact, likelihood, and detectability.
- RPN = Severity x Occurrence x Detection, but equal weighting can under-rank high-severity issues.
- The failure effect drives the Severity score; the failure cause drives Occurrence and Detection.
- Action Priority tables weight severity more heavily than RPN, closing that ranking gap.
- Ratings are relative to a single FMEA and should never be compared across separate analyses.
What Severity, Occurrence, and Detection Represent in FMEA
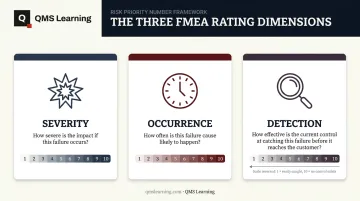
S, O, and D are the three rating dimensions every FMEA team assigns to each failure mode/cause combination. Each gets ranked from 1 to 10 against defined criteria, independently of the other two. Get the assignment level wrong, and the whole prioritization exercise falls apart.
Severity (S)
Severity ranks the seriousness of a failure's worst effect, evaluated without any regard to how likely that failure is or whether current controls would catch it. It's a pure consequence rating.
A few practical notes:
- Severity is typically assigned once per failure effect and shared across every cause linked to that effect.
- If three different causes lead to the same catastrophic effect, all three carry the same severity score.
- Very high severity ratings (9-10) often trigger management review and supplemental analysis like fault tree analysis, though the exact threshold varies by organization and customer requirement.
Occurrence (O)
Occurrence estimates the likelihood that a specific failure cause will happen during the design life (DFMEA) or during production (PFMEA). It draws on field history, test data, and the strength of existing prevention controls.
Here's where teams get tripped up: should Occurrence be rated against the failure mode or the failure cause? Standards bodies settled this question. AIAG, SAE J1739, and VDA all attribute Occurrence to the cause, not the mode.
The logic makes sense once you see it in practice. Take a cable break as a failure mode. It might result from corrosion or from fatigue cracking, two entirely different causes with different likelihoods.
Rating occurrence at the cause level lets each one be prioritized on its own merits, rather than averaging them into a single, less useful mode-level score. Collapse both causes into one rating and you lose the ability to tell your team which corrective action actually matters most.
Detection (D)
Detection measures how effective your current controls are at catching the failure cause or mode before it reaches the customer. This scale runs backward from what people expect:
- 1 = controls will almost certainly catch it (high detection capability)
- 10 = no known control exists at all
A low Detection score is good news. A high one means you're flying blind. The rating hinges on how mature and reliable your verification or inspection method actually is, not just whether one exists on paper.
The 1-10 Rating Scales for Severity, Occurrence, and Detection
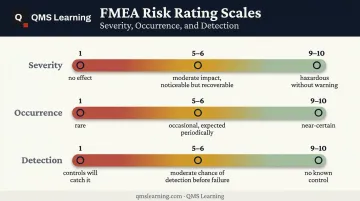
Each scale runs on criteria customized to the specific product, process, or industry. Despite the customization, AIAG, SAE J1739, and VDA-based FMEAs follow a broadly consistent structure across all three ratings.
Severity Scale Anchors
Severity scales generally anchor at 1 = no discernible effect and climb toward 9-10 = hazardous, safety- or regulatory-noncompliance failure that occurs without warning. A simplified version looks like this:
| Rating | Description |
|---|---|
| 1 | No discernible effect on product or process |
| 2-3 | Minor effect; slight customer annoyance |
| 4-6 | Moderate effect; some customer dissatisfaction, rework required |
| 7-8 | High effect; product inoperable, major customer dissatisfaction |
| 9-10 | Hazardous effect; safety or regulatory noncompliance, often without warning |
Your organization's actual scale should reflect your product and customer requirements, not a generic template pulled off the internet.
Occurrence Scale Anchors
Occurrence anchors traditionally ranged from very rare (roughly one failure in thousands of units or years of operation) up to near-certain (multiple failures per operating cycle). That's changing.
Current AIAG-VDA guidance leans toward descriptive criteria instead of rigid failure-rate numbers, largely because teams misapplied those numbers when field data for new designs didn't exist. Rating "by feel" against a fake precision number created more inconsistency than it solved.
Now, teams are encouraged to base the rating on product experience and the strength of prevention controls already in place, described qualitatively rather than pinned to a specific rate.
Detection Scale Anchors
Detection anchors run from "controls will almost certainly detect the cause" (1) to "no known control exists" (10). Where a rating lands in between depends on two factors: detection method maturity (whether it's a proven, long-used inspection technique or a brand-new test method still being validated) and opportunity for detection (whether the control catches the issue early enough to act or only after the part has already shipped).
A newly implemented test method that hasn't been proven out yet earns a middling score, even if it's theoretically sound, because maturity matters as much as method.
Assigning Ratings Consistently
When a rating seems to fall between two scale points, the practical rule is simple: default to the higher, more conservative number. Rounding down to make the FMEA look better defeats the entire purpose of the exercise.
Ratings should also reflect team consensus, not a mathematical average of individual scores. Averaging blurs disagreement instead of resolving it. If your process engineer rates Occurrence a 6 and your quality engineer rates it a 3, that three-point gap needs a conversation, not a quiet split down the middle.
Calculating RPN, SxO, and Action Priority
Once S, O, and D are assigned, the core formula is straightforward:
RPN = Severity x Occurrence x Detection
This produces a value from 1 (best case) to 1,000 (worst case), used to rank relative risk across every failure cause in the FMEA.
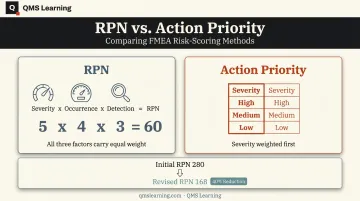
Worked example: S=5, O=4, D=3 → RPN = 60. On its own, that number means nothing. It only becomes useful when compared against every other RPN in the same analysis, sorted from highest to lowest.
Where RPN Breaks Down
Because RPN weights all three factors equally, it can badly misrank risk. Consider this comparison:
| Scenario | Severity | Occurrence | Detection | RPN |
|---|---|---|---|---|
| Case A | 10 | 4 | 2 | 80 |
| Case B | 7 | 4 | 4 | 112 |
Case B scores higher on paper. But Case A carries a severity of 10, meaning safety or regulatory consequences. As HBK's analysis of RPN limitations points out, ranking a safety-critical failure below a moderate one is exactly the trap RPN sets for teams that treat it as the final word.
The SxO Alternative
Some teams sidestep this problem with SxO (also called qualitative criticality): Severity multiplied by Occurrence, with Detection left out entirely. This keeps the consequence-and-likelihood picture visible without letting current detection controls soften the ranking. Teams typically reach for SxO when they want to prioritize design improvements based on inherent risk, independent of how good their inspection process happens to be.
Action Priority (AP) Tables
AIAG-VDA and SAE J1739:2021 both introduced Action Priority tables as an alternative to raw RPN math. Instead of multiplying three numbers together, AP classifies each risk as High, Medium, or Low using defined combinations of S, O, and D — weighted in that order, severity first.
This directly fixes the RPN equal-weighting problem. A high-severity, low-occurrence issue can still land in the High AP category even with a modest RPN, because severity carries more weight in the lookup table than in the multiplication.
One important detail from the official AIAG-VDA errata: if no corrective action is actually taken on a failure cause, both the risk and the Action Priority remain unchanged. Reassigning numbers alone won't change the AP rating. Only addressing the underlying risk does.
Initial vs. Revised RPN
After implementing corrective actions, the team reassigns S, O, and D and recalculates RPN. Comparing the two shows the FMEA's actual effectiveness:
% RPN reduction = (Initial RPN − Revised RPN) ÷ Initial RPN
If initial RPN was 280 and revised RPN comes in at 168, that's a 40% reduction, concrete evidence that the corrective action moved the needle instead of just checking a box.
Common Mistakes and Misinterpretations When Rating S, O, and D
Even experienced quality teams fall into a handful of predictable traps when rating S, O, and D. Watch for these:
- Treating RPN as an absolute metric. RPN and individual S/O/D scores are only valid within one FMEA, rated by one consistent team against one consistent scale. Comparing an RPN of 120 on this year's FMEA to a 120 on last year's is meaningless unless the same criteria and team produced both.
- Rating Occurrence against the effect instead of the cause. This collapses multiple causes into one score and hides which corrective action actually deserves priority.
- Skipping cross-functional input on Severity. Safety- and compliance-related effects often need input beyond the immediate design or process team: legal, regulatory affairs, or a safety engineer may see consequences the core team misses.
- Letting individual memory drive the rating. When quality engineers rate Occurrence or Detection "by feel" instead of against written criteria, scores drift across engineers and across time. This inconsistency is a recurring theme auditors flag in AS9100D and IATF 16949 reviews of FMEA documentation.
That last point is where a structured method-selection process earns its keep. QMS Learning's AI Workbench includes a Method Router that diagnoses the compliance problem first, then routes the team to the correct methodology, FMEA, 5-Why, or CAPA, using the same diagnostic logic every time.
This won't replace engineering judgment on the actual S/O/D values. It does remove the guesswork about which method and documentation structure the situation calls for. The Commercial Aviation pathway builds on this same logic, teaching FMEA alongside AS13000 8D and 5-Why analysis for teams closing findings on repair and MRO work.
Conclusion
Severity, Occurrence, and Detection are relative rating scales, not absolute measurements. Their entire value comes from consistent, well-reasoned application inside a single FMEA, rated by a cross-functional team using the same written criteria every time.
That discipline matters most once the ratings feed into prioritization. RPN and Action Priority help rank where to act, but they can't replace engineering judgment. When severity signals a genuine safety or regulatory concern, that concern deserves attention regardless of what the multiplied score says.
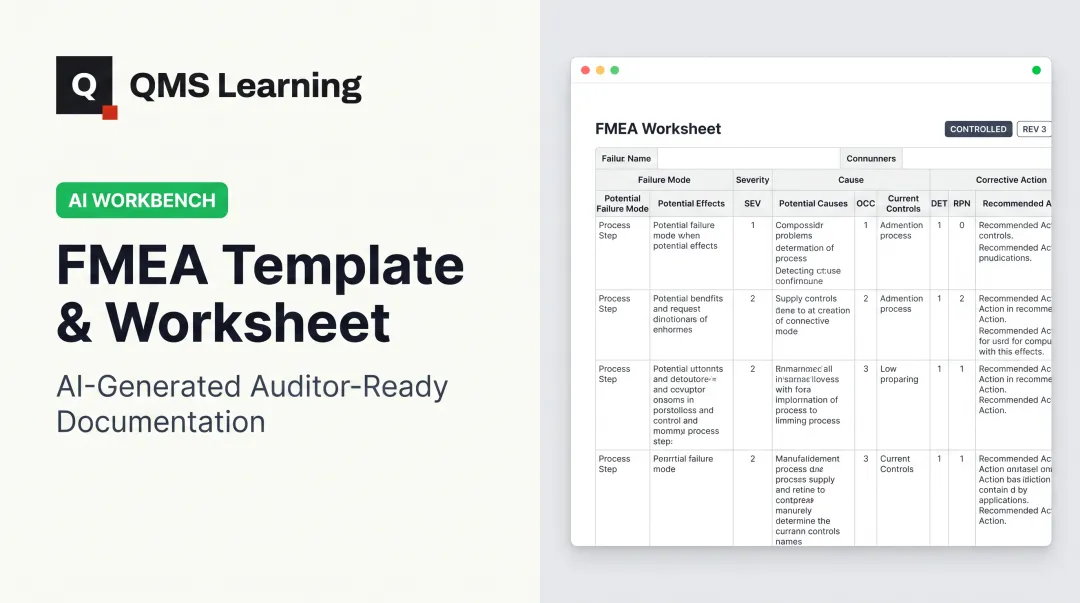
This same judgment is what auditors look for. A properly rated and documented FMEA proves your risk management process actually functions, instead of just sitting in a binder. QMS Learning's AI Workbench helps quality teams generate that kind of audit-ready FMEA documentation consistently, rather than reconstructing it under pressure the week before a surveillance audit.
Frequently Asked Questions
What are severity, occurrence, and detection in FMEA?
They're independent 1-10 scales measuring how serious a failure's effect is, how likely its cause is to occur, and how well current controls would catch it before the customer does. Each rating follows its own defined criteria.
How do you calculate severity, occurrence, and detection in FMEA?
A cross-functional team rates each factor separately against written scale criteria, then multiplies the three scores together to produce the RPN. Severity applies to the effect; Occurrence and Detection apply to the cause.
What is a good RPN score in FMEA?
There's no universal "good" threshold. Teams define their own High/Medium/Low bands for their specific analysis, and any cause with a high severity score deserves attention regardless of the overall RPN.
Is severity or occurrence more important in FMEA?
Severity is treated as the more critical factor since it reflects consequences to safety or compliance. That's exactly why Action Priority tables weight severity more heavily than RPN's equal multiplication does.
What's the difference between RPN and Action Priority (AP)?
RPN multiplies all three scores with equal weight, while AP uses defined combinations of S, O, and D to classify risk as High, Medium, or Low. AP prevents a high-severity issue from getting buried under a lower composite number.
Should occurrence be rated on the failure mode or the failure cause?
Occurrence should be rated against the failure cause, per AIAG, SAE J1739, and VDA guidance. Rating it at the cause level differentiates risk between multiple causes of the same failure mode, which sharpens corrective-action priority.